Building Your Dream Home in the United Kingdom: A Comprehensive Guide to Costs Per Square Foot and Considerations for New Construction Homes
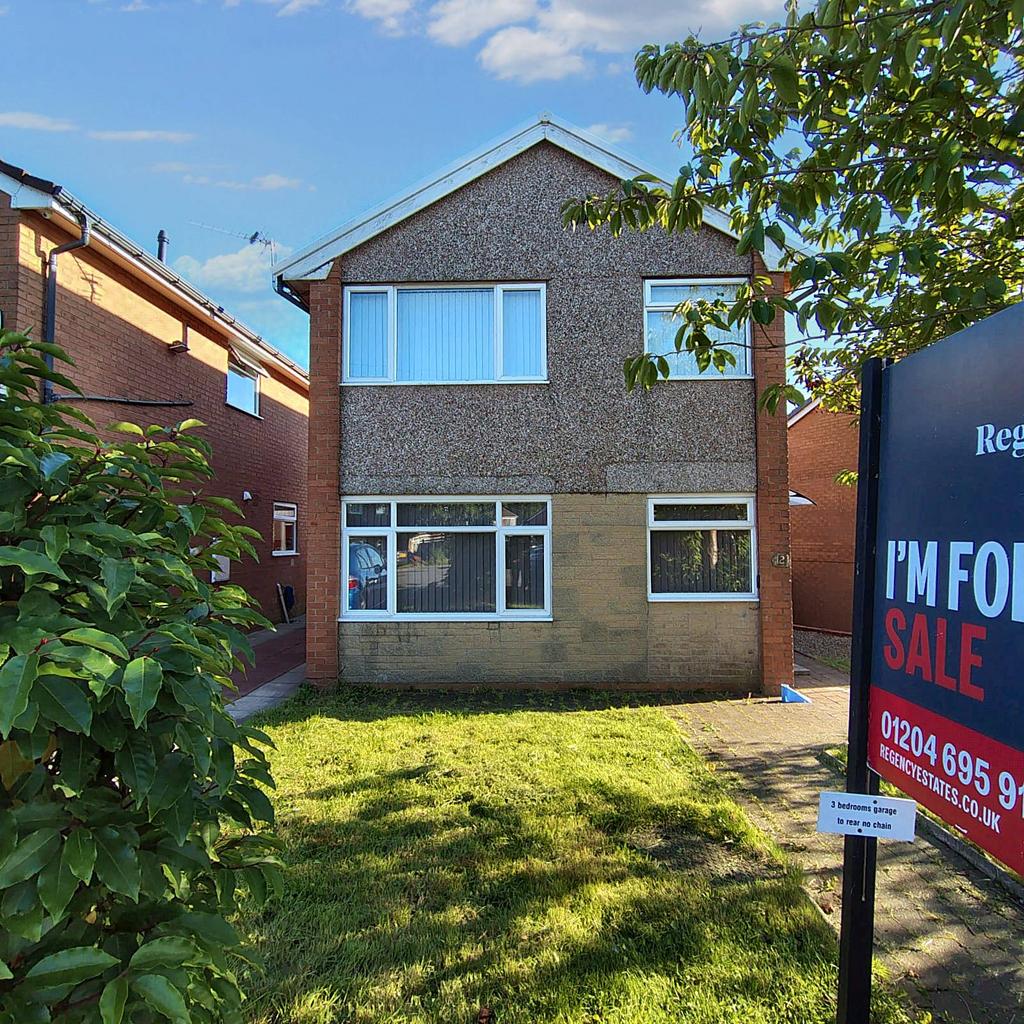
3 Bedroom Detached Double Storey House for Sale, with 1 Bathroom on GFA 66.2m2 – Ground Floor 35.4m2, Upper Floor 30.8m2 – Located on Snowdon Drive, Horwich BL6 – Price £209,975
Introduction: Navigating the UK’s New Construction Market
The United Kingdom’s housing market in 2025 reflects a dynamic interplay of economic, regulatory, and societal factors, making it an exciting yet complex landscape for aspiring home builders and buyers seeking new construction homes. With a growing population, urban expansion, and government initiatives to address housing shortages, the demand for new homes remains robust. According to recent industry data, approximately 160,000 new homes were completed in the UK in 2024, with projections for 2025 suggesting a modest increase to around 170,000-180,000 units, driven by government-backed schemes like Help to Buy and Shared Ownership. However, challenges such as rising material costs, labor shortages, and stringent planning regulations continue to shape the market.
The median selling price for new-build homes in the UK is approximately £375,000, though this varies significantly by region, with London commanding premiums of over £600,000 for modest properties and rural areas offering more affordable options around £250,000-£300,000. Construction costs have risen by 10-15% over the past two years due to global supply chain disruptions and increased energy prices, impacting materials like timber, steel, and concrete. Labor shortages, exacerbated by Brexit and an aging workforce, have driven skilled labor costs up by 8-12% annually. The UK Construction Price Index, a key indicator of building costs, reported a 5.7% increase in Q3 2024, signaling continued upward pressure on expenses.
Despite these challenges, opportunities abound. The government’s commitment to building 1.5 million homes by 2030, as outlined in recent policy updates, has spurred proposed projects, particularly in the Southeast, Midlands, and Northern Powerhouse regions. These include large-scale developments like the Oxford-Cambridge Arc and urban regeneration projects in cities like Birmingham and Manchester. For aspiring builders, navigating this market requires a keen understanding of costs, land availability, and regional variations. This article leverages comprehensive data from Savills, Knight Frank, and OnTheMarket to provide a detailed analysis of new construction costs, sizes, and critical considerations for building or buying a new home in the UK.
Quantitative Analysis of New Construction Homes in the UK
Methodology and Data Sources
The analysis is based on property listings from three major UK real estate platforms: Savills.com, KnightFrank.co.uk, and OnTheMarket.com, as provided in the CSV files. These datasets include detailed information on property types, sizes, prices, and features, enabling a robust quantitative assessment. The selling price is used to calculate costs, which includes land, construction, and developer profit margins. Note that actual construction costs (excluding land and profit) are typically 60-75% of the selling price, depending on location and market conditions.
C: Price Ranges and Cost Analysis
C1: Price Range – Building Costs Per Square Foot by Gross Floor Area and Type of Building
………………………………..
Complete Merged Property Data Summary
Studio Properties (0 Bedrooms)
Summary Table (Source: OnTheMarket.com)
| Type |
Bedrooms |
Floor Area (sqft) |
Price Range |
| Flat |
0 |
481 |
£60,000 – £665,000 |
Price Per Square Foot Analysis
| Type |
Bedrooms |
Price Per Square Foot Range |
Average Cost Per Square Foot |
| Flat |
0 |
£125 – £1,382* |
£754 |
1-Bedroom Properties
Summary Table (Source: OnTheMarket.com)
| Type |
Bedrooms |
Floor Area (sqft) |
Price Range |
| Flat / Apartment |
1 |
375 – 732 |
£55,000 – £970,000 |
| Terraced House |
1 |
505 – 581 |
£85,000 – £114,975 |
| End of Terrace House |
1 |
Not specified |
£129,975 |
| Maisonette |
1 |
Not specified |
£200,000 |
| Semi-Detached Bungalow |
1 |
Not specified |
£130,000 |
| Retirement Property |
1 |
Not specified |
£95,000 |
| Property with Land |
1 |
Not specified |
£75,000 |
| Houseboat |
1 |
Not specified |
£130,000 |
Price Per Square Foot Analysis
| Type |
Bedrooms |
Price Per Square Foot Range |
Average Cost Per Square Foot |
| Flat / Apartment |
1 |
£75 – £2,587 |
£1,331 |
| Terraced House |
1 |
£146 – £228 |
£187 |
| End of Terrace House |
1 |
N/A |
N/A |
| Maisonette |
1 |
N/A |
N/A |
| Semi-Detached Bungalow |
1 |
N/A |
N/A |
| Retirement Property |
1 |
N/A |
N/A |
| Property with Land |
1 |
N/A |
N/A |
| Houseboat |
1 |
N/A |
N/A |
2-Bedroom Properties
Summary Table (Source: OnTheMarket.com)
| Type |
Bedrooms |
Floor Area (sqft) |
Price Range |
| End of Terrace House |
2 |
635 |
£110,000 – £400,000 |
| Flat |
2 |
710 |
£95,000 – £3,700,000 |
| Bungalow |
2 |
920 |
£240,000 – £625,000 |
| Terraced House |
2 |
635 – 1,087 |
£60,000 – £550,000 |
| Semi-Detached House |
2 |
Not specified |
£116,000 – £465,000 |
| Detached House |
2 |
Not specified |
£295,000 |
| Apartment |
2 |
710 |
£136,250 – £408,750 |
| Penthouse |
2 |
Not specified |
£525,000 |
| House |
2 |
Not specified |
£199,995 |
Price Per Square Foot Analysis
| Type |
Bedrooms |
Price Per Square Foot Range |
Average Cost Per Square Foot |
| End of Terrace House |
2 |
£173* |
£173 |
| Flat |
2 |
£134 – £5,211 |
£2,673 |
| Bungalow |
2 |
£261* |
£261 |
| Terraced House |
2 |
£55 – £866 |
£461 |
| Semi-Detached House |
2 |
N/A |
N/A |
| Detached House |
2 |
N/A |
N/A |
| Apartment |
2 |
£192 – £576 |
£384 |
| Penthouse |
2 |
N/A |
N/A |
| House |
2 |
N/A |
N/A |
3-Bedroom Properties
Summary Table (Source: OnTheMarket.com)
| Type |
Bedrooms |
Floor Area (sqft) |
Price Range |
| Detached House |
3 |
818 – 1,001 |
£209,975 – £2,000,000 |
| Semi-Detached House |
3 |
764 – 914 |
£179,975 – £535,000 |
| Terraced House |
3 |
796 – 1,054 |
£85,000 – £244,995 |
| End of Terrace House |
3 |
731 – 1,140 |
£129,950 – £540,000 |
| Townhouse |
3 |
721 – 925 |
£149,975 – £169,975 |
| Cottage |
3 |
Not specified |
£355,000 |
| Apartment |
3 |
Not specified |
£335,000 |
| Detached Bungalow |
3 |
Not specified |
£525,000 |
Price Per Square Foot Analysis
| Type |
Bedrooms |
Price Per Square Foot Range |
Average Cost Per Square Foot |
| Detached House |
3 |
£210 – £1,997 |
£1,104 |
| Semi-Detached House |
3 |
£197 – £585 |
£391 |
| Terraced House |
3 |
£81 – £262 |
£172 |
| End of Terrace House |
3 |
£114 – £474 |
£294 |
| Townhouse |
3 |
£162 – £236 |
£199 |
| Cottage |
3 |
N/A |
N/A |
| Apartment |
3 |
N/A |
N/A |
| Detached Bungalow |
3 |
N/A |
N/A |
4-Bedroom Properties
Summary Table (Source: OnTheMarket.com)
| Type |
Bedrooms |
Floor Area (sqft) |
Price Range |
| Detached House |
4 |
1,087* |
£15,000 – £1,000,000 |
| Semi-Detached House |
4 |
1,087* |
£15,000 – £368,995 |
| Terraced House |
4 |
1,377* |
£15,000 – £177,975 |
| Townhouse |
4 |
968* |
£199,975 |
| Flat |
4 |
Not specified |
£15,000 |
*Note: Floor area is based on a single data point.
Price Per Square Foot Analysis
| Type |
Bedrooms |
Price Per Square Foot Range |
Average Cost Per Square Foot |
| Detached House |
4 |
£14 – £920* |
£467 |
| Semi-Detached House |
4 |
£14 – £339* |
£177 |
| Terraced House |
4 |
£11 – £129* |
£70 |
| Townhouse |
4 |
£207* |
£207 |
| Flat |
4 |
N/A |
N/A |
Note: The 4-bedroom data is heavily influenced by low-priced social housing investments (£15,000), skewing the price per square foot calculations.
5-Bedroom Properties
Summary Table (Source: OnTheMarket.com)
| Type |
Bedrooms |
Floor Area (sqft) |
Price Range |
| Detached House |
5 |
Not specified |
£335,000 – £1,750,000 |
| Semi-Detached House |
5 |
Not specified |
£280,000 – £750,000 |
| Terraced House |
5 |
Not specified |
£15,000 – £1,000,000 |
| End of Terrace House |
5 |
Not specified |
£425,000 |
| House of Multiple Occupation |
5 |
Not specified |
£225,000 – £280,000 |
| Detached Villa |
5 |
Not specified |
£420,000 |
Price Per Square Foot Analysis
No floor area data was provided for 5-bedroom properties.
| Type |
Bedrooms |
Price Per Square Foot Range |
Average Cost Per Square Foot |
| All Types |
5 |
N/A |
N/A |
6-Bedroom Properties
Summary Table (Source: OnTheMarket.com)
| Type |
Bedrooms |
Floor Area (sqft) |
Price Range |
| Detached House |
6 |
1,636 – 2,346 |
£345,000 – £2,000,000 |
| House |
6 |
1,926 |
£1,000,000 – £1,600,000 |
| Terraced House |
6 |
Not specified |
£325,000 – £395,000 |
| Semi-Detached House |
6 |
Not specified |
£759,000 – £2,000,000 |
| House of Multiple Occupation |
6 |
Not specified |
£440,000 |
| Bungalow |
6 |
Not specified |
£600,000 – £799,999 |
| Cottage |
6 |
Not specified |
£395,000 – £700,000 |
Price Per Square Foot Analysis
| Type |
Bedrooms |
Price Per Square Foot Range |
Average Cost Per Square Foot |
| Detached House |
6 |
£147 – £1,222 |
£685 |
| House |
6 |
£519* |
£519 |
| Terraced House |
6 |
N/A |
N/A |
| Semi-Detached House |
6 |
N/A |
N/A |
| House of Multiple Occupation |
6 |
N/A |
N/A |
| Bungalow |
6 |
N/A |
N/A |
| Cottage |
6 |
N/A |
N/A |
7-Bedroom Properties
Summary Table (Source: OnTheMarket.com)
| Type |
Bedrooms |
Floor Area (sqft) |
Price Range |
| Detached House |
7 |
Not specified |
£750,000 – £2,395,000 |
| Semi-Detached House |
7 |
Not specified |
£600,000 – £35,000,000 |
| Block of Apartments |
7 |
Not specified |
£790,000 |
| Guest House |
7 |
Not specified |
£900,000 |
| Farm House |
7 |
Not specified |
£1,350,000 |
| Link Detached House |
7 |
6,089 |
£1,995,995 |
| Terraced House |
7 |
Not specified |
£435,000 |
Price Per Square Foot Analysis
| Type |
Bedrooms |
Price Per Square Foot Range |
Average Cost Per Square Foot |
| Detached House |
7 |
N/A |
N/A |
| Semi-Detached House |
7 |
N/A |
N/A |
| Block of Apartments |
7 |
N/A |
N/A |
| Guest House |
7 |
N/A |
N/A |
| Farm House |
7 |
N/A |
N/A |
| Link Detached House |
7 |
£328* |
£328 |
| Terraced House |
7 |
N/A |
N/A |
Data from Knight Frank & Rutley (Mixed Bedrooms)
Summary Table
| Type |
Bedrooms |
Floor Area (sqft) |
Price Range |
| Flat |
1 |
285 – 1,047 |
£150,000 – £650,000 |
| Flat |
2 |
422 – 1,345 |
£230,000 – £750,000 |
| Flat |
3 |
1,179 – 1,518 |
£425,000 – £565,000 |
| House |
1 |
661 – 1,144 |
£325,000 – £600,000 |
| House |
2 |
769 – 2,495 |
£225,000 – £650,000 |
| House |
3 |
863 – 2,390 |
£330,000 – £700,000 |
| House |
4 |
1,241 – 3,557 |
£375,000 – £750,000 |
| Development |
1–3 |
398 – 2,069 |
£325,000 – £730,000 |
| Barn Conversion |
1–3 |
646 – 2,671 |
£225,000 – £600,000 |
| Maisonette |
3 |
1,070 – 1,874 |
£600,000 – £695,000 |
| Townhouse |
3–4 |
1,392 – 1,597 |
£565,000 – £625,000 |
Price Per Square Foot Analysis
| Type |
Bedrooms |
Price Per Square Foot Range |
Average Cost Per Square Foot |
| Flat |
1 |
£143 – £1,403 |
£773 |
| Flat |
2 |
£171 – £1,066 |
£619 |
| Flat |
3 |
£280 – £479 |
£380 |
| House |
1 |
£284 – £908 |
£596 |
| House |
2 |
£90 – £845 |
£468 |
| House |
3 |
£138 – £811 |
£475 |
| House |
4 |
£105 – £604 |
£355 |
| Development |
1–3 |
£157 – £1,834 |
£996 |
| Barn Conversion |
1–3 |
£84 – £929 |
£507 |
| Maisonette |
3 |
£320 – £649 |
£485 |
| Townhouse |
3–4 |
£354 – £449 |
£402 |
Data from Savills (Mixed Bedrooms)
Summary Table
| Type |
Bedrooms |
Floor Area (sqft) |
Price Range |
| House |
4 – 12 |
2,126 – 39,724 |
£1,200,000 – £45,000,000 |
| Flat / Apartment |
1 – 9 |
537 – 1,188 |
£585,000 – £54,000,000 |
| New Development |
1 – 9 |
540 – 9,945 |
£490,950 – £40,000,000 |
| Penthouse |
2 |
1,561 |
£2,000,000 |
Price Per Square Foot Analysis
| Type |
Bedrooms |
Price Per Square Foot Range |
Average Cost Per Square Foot |
| House |
4-12 |
£564 – £1,133 |
£849 |
| Flat / Apartment |
1-9 |
£493 – £45,455 |
£22,974 |
| New Development |
1-9 |
£49 – £4,022 |
£2,036 |
| Penthouse |
2 |
£1,281* |
£1,281 |
Note on Savills Data: The price per square foot for “Flat / Apartment” is skewed by an extreme outlier (a £54M apartment), making the average cost figure less representative. The “New Development” category also has a very wide range.
………………………
Key Considerations for Aspiring Home Builders and Buyers
1. Cost Components and Budgeting
- Land Costs: Land prices vary significantly, with urban plots in London costing £1,000-£2,000/sqft and rural plots as low as £50-£100/sqft. The lack of land size data in the dataset highlights the need for site-specific research.
- Construction Costs: Excluding land, construction costs for new homes range from £120-£200/sqft for standard builds to £300-£500/sqft for luxury specifications. Materials (40-50% of costs) and labor (30-40%) are the largest expenses.
- Developer Margins: Selling prices include 20-30% profit margins, inflating costs above raw construction expenses.
- Additional Costs: Planning permissions, legal fees, and infrastructure (e.g., utilities) can add 10-15% to budgets.
2. Location and Market Dynamics
- Urban vs. Rural: Urban areas like London offer proximity to amenities but at a premium, while rural areas provide larger plots and lower costs but may lack infrastructure.
- Regional Variations: The Southeast and London have the highest demand and prices, while the North and Midlands offer better value.
- Supply and Demand: High demand in urban centers strains land availability, pushing prices up. Government incentives for brownfield development may ease this in coming years.
3. Property Type and Size
- Flats vs. Houses: Flats are ideal for urban buyers seeking low-maintenance homes, while houses suit families needing space.
- Bedroom Count: 3- to 5-bedroom houses are the most common new builds, balancing affordability and space. Studios and 1-bedroom flats cater to young professionals or investors.
- Plot Size: Larger plots are rare in urban settings but available in rural areas, impacting privacy and potential for extensions.
4. Regulatory and Environmental Factors
- Planning Permissions: UK planning laws are stringent, with delays common. Engage early with local councils to navigate restrictions.
- Sustainability: New homes must meet energy efficiency standards (e.g., EPC rating B or higher), increasing costs for eco-friendly materials like solar panels or heat pumps.
- Material Availability: Supply chain issues persist, with timber and steel lead times of 12-16 weeks. Plan procurement early to avoid delays.
5. Financing and Incentives
- Mortgages: New-build mortgages often require higher deposits (15-20%), but schemes like Help to Buy can reduce this to 5% for first-time buyers.
- Developer Incentives: Many listings (e.g., OnTheMarket) offer deposit contributions, stamp duty payments, or upgrades (e.g., flooring, kitchens) to attract buyers.
- Investment Potential: Properties like HMOs (OnTheMarket) or luxury flats (Savills) appeal to investors seeking rental yields of 4-6% in urban areas.
Practical Steps for Aspiring Builders and Buyers
- Research and Budgeting:
- Use platforms like Savills, Knight Frank, and OnTheMarket to benchmark prices and sizes.
- Factor in land, construction, and ancillary costs, aiming for a 10-15% contingency buffer.
- Site Selection:
- Prioritize locations based on lifestyle needs (e.g., urban access vs. rural tranquility).
- Engage surveyors to assess land suitability, including soil conditions and access to utilities.
- Design and Planning:
- Work with architects to design homes that meet local regulations and personal needs.
- Consider modular or prefabricated construction to reduce costs and timelines (10-20% savings).
- Financing and Legal:
- Secure pre-approval for mortgages or loans to streamline negotiations.
- Hire conveyancers to handle legalities, including title deeds and planning permissions.
- Construction Management:
- Choose reputable builders with experience in new builds to ensure quality and compliance.
- Monitor material and labor costs closely, locking in prices where possible to hedge against inflation.
Conclusion
Building or buying a new construction home in the UK in 2025 offers exciting opportunities but requires careful planning due to rising costs, regulatory hurdles, and regional disparities. The data from Savills, Knight Frank, and OnTheMarket highlights a diverse market, with prices ranging from £60,000 for compact studios to £75M for luxury London houses. By understanding costs per square foot, land availability, and property types, aspiring builders and buyers can make informed decisions. Whether opting for a modest 3-bedroom house in the Midlands or a high-end apartment in London, thorough research, strategic financing, and proactive engagement with professionals will ensure a successful journey to homeownership in the UK’s vibrant new-build market.